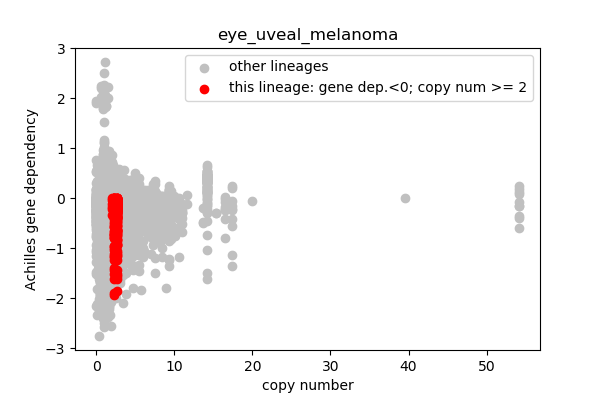
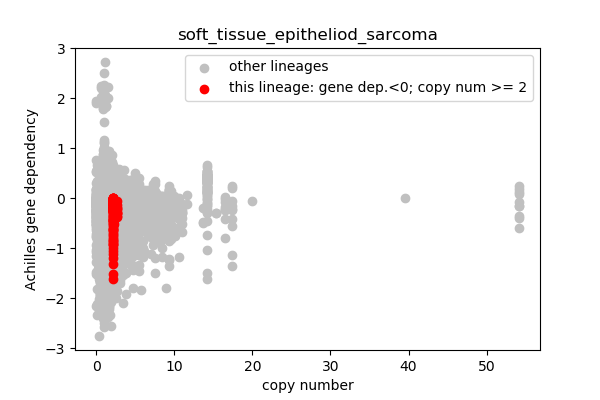
DepMap Analysis
In [1]:
from __future__ import print_function
import pandas as pd
import numpy as np
import os, sys, re, pickle, wget, math
from intermine.webservice import Service
from IPython.display import Markdown, display
import matplotlib.pyplot as plt
import scipy.stats as stats

# Load data direct from source
class A(object):
    data = {}
    url = {}
    url['expression'] = 'https://ndownloader.figshare.com/files/16757690'
    url['sample_info'] = 'https://ndownloader.figshare.com/files/16757723'
    url['copy_number'] = 'https://ndownloader.figshare.com/files/17857886'
    url['mutations'] = 'https://ndownloader.figshare.com/files/16757702'
    url['achilles_crispr'] = 'https://ndownloader.figshare.com/files/16757666'
    url['d2_rnai'] = 'https://ndownloader.figshare.com/files/13515395'
    url['sensitivity'] = 'https://ndownloader.figshare.com/files/17008628'
    url['mfr'] = 'http://bmbl.sdstate.edu/MFR/data/resource%20data/tr_dv_ts.dataset.zip'
    url['reactome'] = 'https://reactome.org/download/current/NCBI2Reactome.txt'
    summary = '../README.md'

# Wipe the slate clean on the analysis summary
os.system("echo '' > "+A.summary)

def printmd(string):
    """Prints formatted markdown text"""
    display(Markdown(string))

def report(text,silent=False):
    """Print markdown in this notebook and saves markdown-only summary in a file"""
    if not silent:
        printmd(text)

    f = open(A.summary,'a')
    f.write(text+'\n')

def get_gene_descriptions():
    """Load gene names and descriptions from humanmine (http://www.humanmine.org),
    an integrated database of human genome information.  Use cached data if available"""

    archive = 'data/gene_info.p'
    if os.path.exists(archive):
        df = pd.read_pickle(archive)
        return df

    service = Service("https://www.humanmine.org/humanmine/service")
    query = service.new_query("Gene")
    cols = ["primaryIdentifier", "symbol", "briefDescription", "description","proteins.uniprotAccession"]
    query.add_view(*cols)
    query.add_constraint("organism.taxonId", "=", "9606", code = "A")
    df_rows = []

    for row in query.rows():
        df_rows.append(
            [row["primaryIdentifier"],
             row["symbol"],
             row["briefDescription"],
             row["description"],
             row["proteins.uniprotAccession"]
            ])

    df = pd.DataFrame(data=df_rows,columns=cols)
    df.to_pickle(archive)
    return df

def get_data(key):
    """Load input data.
    Arguments: key for the data source (eg: expression, sample_info...)
    1) If the data is cached on the filesystem, load and return the dataframe
    2) Otherwise, load the data from the source URL, cache, return the dataframe
    """

    data_cache = 'data/'+key+'.p'
    if os.path.exists(data_cache):
        df = pd.read_pickle(data_cache)
    else:
        print("Downloading",key,"from source")
        df = pd.read_csv(A.url[key],low_memory=False,index_col=0)
        df.to_pickle(data_cache)

    A.data[key] = df
    return df

def ncbi_gene_ids(genes):
    """Converts gene name "symbol (ncbi_id)"
    to integer NCBI ID.  Also catch missing associations
    for NCBI gene ID/symbol
    """
    ncbi_cols = []
    for g in genes:
        match = re.search('(\S+)\s+\((\d+)\)',g)
        if match:
            s = match.group(1)
            g = match.group(2)
            if not ncbi2symbol.get(int(g)):
                ncbi2symbol[int(g)] = s
                symbol2ncbi[s] = int(g)
        else:
            print("No match",g)
        ncbi_cols.append(int(g))


    return ncbi_cols

def get_pathway_info():
    # Map NCBI IDs to reactome pathways
    # File downloaded from https://reactome.org/download/current/NCBI2Reactome.txt
    archive = 'data/pathway_info.p'

    if os.path.exists(archive):
        pathway_info = pickle.load(open(archive,'rb'))
        return pathway_info

    pathway_info = {}
    if not os.path.exists('data/NCBI2Reactome.txt'):
        wget.download(A.url['reactome'],out='data/NCBI2Reactome.txt')
    with open('data/NCBI2Reactome.txt') as n2r:
        for line in n2r.readlines():
            ncbi, pathway_id, url, pathway_name, type, species = line.strip().split('\t')
            # only human pathways
            if species != 'Homo sapiens':
                continue
            # only curated pathways
            if type == 'IEA':
                continue
            pathway_info[ncbi] = [pathway_id, url, pathway_name]

    pickle.dump(pathway_info,open(archive,'wb'))
    return pathway_info
In [2]:
report('''
# Sample analysis of Cancer Dependency Map (DepMap) data
## Request
* Identify the most frequent genetic alterations (could be mutations or copy number variations) in the cancer cell lines
* Match them with the best genetic dependencies that could be used for drug development for the cancers that carry those mutations
* Take into account the lineage of cancer cell lines (certain mutations/CNVs may be restricted to a specific lineage)

## Resources
### DepMap (https://depmap.org/portal) Data
* Cell line metadata
* Expression (RNASeq)
* Copy number variation
* Mutations
* Genetic dependency
  * Crispr (Achilles)
  * RNAi (DEMETER2)

<b>Citations:</b>
* Jordan G. Bryan, John M. Krill-Burger, Thomas M. Green, Francisca Vazquez, Jesse S. Boehm, Todd R. Golub, William C. Hahn, David E. Root, Aviad Tsherniak. (2018). Improved estimation of cancer dependencies from large-scale RNAi screens using model-based normalization and data integration. Nature Communications 9, 1. https://doi.org/10.1038/s41467-018-06916-5</font>
* DepMap, Broad (2019): DepMap 19Q3 Public. figshare. Dataset doi:10.6084/m9.figshare.9201770.v1.
* Robin M. Meyers, Jordan G. Bryan, James M. McFarland, Barbara A. Weir, ... David E. Root, William C. Hahn, Aviad Tsherniak. Computational correction of copy number effect improves specificity of CRISPR-Cas9 essentiality screens in cancer cells. Nature Genetics 2017 October 49:1779–1784. doi:10.1038/ng.3984


### Jupyter (https://jupyter.org/)
* Python programming framework for analysis prototyping and reporting

### GitHub (https://github.com/)
* Revision control for Python code
* Reporting mechanism for analysis summary and details


## Analysis overview
1. Aggregate data from depmap.org
2. Deal with various data format issues
3. Map cell lines to cancer lineages and sublineages
4. Capture low-hanging fruit genes with high copy number and (Achilles Crispr) gene dependency scores < 0
5. Sanity check filters using ERBB2
6. Compare RNAi and Crispr data fo gene dependency
7. Plot copy number vs. gene dependency by lineage
8. Generate list of candidate genes as a sortable table
9. Add cross-validation filtering data for RNAi, expression, TGCA/COSMIC mutation hotspots
10. target gene info pages

## Next steps
1. Improve thresholds (cutoffs for copy number, gene dependency, expression TPMs, etc.
2. Integrate chemical sensitivity data
3. Filter genes that are already known drug targets (identify truly novel targets)

<a href="analysis/anaysis_details.html">Details...</a>

''')
In [3]:
printmd('''
## Get gene descriptions, etc.
Use data from humanmine (http://www.humanmine.org/) to map NCBI gene IDs to name, summary, symbol, uniprot
''')
In [4]:
gd = get_gene_descriptions()
printmd('sample gene info:')
display(gd.head())
ncbi2name    = {}
ncbi2symbol  = {}
symbol2ncbi  = {}
ncbi2desc    = {}
ncbi2uniprot = {}
uniprot2ncbi = {}

for i, r in gd.iterrows():
    ncbi, symbol, name, description, uniprot = list(r)
    ncbi = int(ncbi)
    ncbi2name[ncbi] = name
    ncbi2symbol[ncbi] = symbol
    ncbi2desc[ncbi] = description

    # ncbi <-> uniprot can be 1:many
    if ncbi2uniprot.get(ncbi) is None:
        ncbi2uniprot[ncbi] = set()
    ncbi2uniprot[ncbi].add(uniprot)
    uniprot2ncbi[uniprot] = ncbi

print("Done mapping gene info")
In [5]:
report('''
## Aggregate CCLE cell lines by lineage
<b>DepMap source file:</b> sample_info.csv
* Group all cell lines (CCLE cell line IDs) by main (parent) lineage
* If a lineage has > 1 defined sublineages, also aggregate cell lines by sublineage (eg: leukemia -> AML)
''')
In [6]:
sample_info = get_data('sample_info')
lineages = set(sample_info.lineage.dropna())

lineage2cell    = {}
sublineage2cell = {}
cell2lineage    = {}
cell2sublineage = {}
has_sub = set()
is_sub = set()

for l in lineages:
    ldf = sample_info[sample_info.lineage == l]
    subtypes = set(ldf.lineage_subtype.dropna())

    # cell lines for sublineage
    if len(subtypes) > 1:
        has_sub.add(l)
        for sub in subtypes:
            if l in sub:
                lname = sub
            else:
                lname = l + '_' + sub

            is_sub.add(lname)
            sub_df = ldf[ldf.lineage_subtype == sub]

            # map sublineage to cell lines
            sublineage2cell[lname] = list(sub_df.index)

            # map cell lines to sub-lineage
            for cell in sublineage2cell[lname]:
                cell2sublineage[cell] = lname
    else:
        sublineage2cell[l] = list(ldf.index)
        for cell in sublineage2cell[l]:
            cell2sublineage[cell] = l

    # all cell lines for lineage
    lineage2cell[l] = list(ldf.index)

    # parent lineage of each cell line
    for cell in lineage2cell[l]:
        cell2lineage[cell] = l


report('<pre>')
report("Number of cell lines: "+str(len(cell2lineage)))
report("Number of lineages: "+str(len(lineage2cell)))
report("Number of lineages with sub-lineages: "+str(len(has_sub)))
report("Number of sub-lineages "+str(len(is_sub)))
report('</pre>')
In [7]:
report('''
## Expression Data (RNASeq)
RNAseq TPM gene expression data for just protein coding genes using RSEM. Log2 transformed, using a pseudo-count of 1.

<b>DepMap source file:</b> CCLE_expression.csv
* Transpose columns (gene names) and rows (CCLE cell line IDs)
* Translate gene names to NCBI gene IDs
''')
In [8]:
exp = get_data('expression').T
exp.index = ncbi_gene_ids(list(exp.index))
printmd('Sample expression data:')
display(exp.head())
In [9]:
report('''
## Mutation Data
<b>DepMap source file:</b> CCLE_mutations.csv
* Keep track of TCGA and COSMIC hotspot genes by lineage
* Just using hotspot genes for now but track deleterious mutations by lineage for future reference
''')
In [10]:
mutations = get_data('mutations')
In [11]:
# Filter hotspot genes
hotspots = []
hotspots.append(mutations[mutations.isTCGAhotspot])
hotspots.append(mutations[mutations.isCOSMIChotspot])
hotspots = pd.concat(hotspots).drop_duplicates()

hotspot_genes = set(hotspots.Entrez_Gene_Id)

lineage_hotspots = {}
sublineage_hotspots = {}

for g in hotspot_genes:
    lineage_hotspots[g] = {}
    sublineage_hotspots[g] = {}

    gdf = hotspots[hotspots.Entrez_Gene_Id == g]

    for i, r in gdf.iterrows():
        cell = r.DepMap_ID
        if cell2lineage.get(cell) is not None:
            lineage = cell2lineage[cell]
            if lineage_hotspots[g].get(lineage) is None:
                lineage_hotspots[g][lineage] = 0
            lineage_hotspots[g][lineage] += 1

        if cell2sublineage.get(cell) is not None:
            sublineage = cell2sublineage[cell]
            if sublineage_hotspots[g].get(sublineage) is None:
                sublineage_hotspots[g][sublineage] = 0
            sublineage_hotspots[g][sublineage] += 1

print("Done mapping hotspots")
report(str(len(hotspot_genes))+' TCGA or COSMIC hotspot genes')
In [12]:
# # Filter deleterious mutations
# damaging = mutations[mutations.Variant_annotation.isin(['damaging','non-conserving'])]
# damaging = damaging[damaging.isDeleterious == True]
# genes = set(hotspots.Entrez_Gene_Id)


# genes = set(damaging.Entrez_Gene_Id)

# lineage_mutations = {}
# sublineage_mutations = {}

# for g in genes:
#     lineage_mutations[g] = {}
#     sublineage_mutations[g] = {}

#     gdf = damaging[damaging.Entrez_Gene_Id == g]

#     for i, r in gdf.iterrows():
#         cell = r.DepMap_ID
#         if cell2lineage.get(cell) is not None:
#             lineage = cell2lineage[cell]
#             if lineage_mutations[g].get(lineage) is None:
#                 lineage_mutations[g][lineage] = 0
#             lineage_mutations[g][lineage] += 1

#         if cell2sublineage.get(cell) is not None:
#             sublineage = cell2sublineage[cell]
#             if sublineage_mutations[g].get(sublineage) is None:
#                 sublineage_mutations[g][sublineage] = 0
#             sublineage_mutations[g][sublineage] += 1

# print("Done mapping deleterious mutations")
In [13]:
report('''
## Copy number data
Gene level copy number data, log2 transformed with a pseudo count of 1. This is generated by mapping genes onto the segment level calls.

<b>Depmap source file:</b> CCLE_gene_cn_v2.csv
* Transpose columns (gene names) and rows (CCLE cell line IDs)
* Translate gene names to NCBI gene IDs
''')
In [14]:
cn = get_data('copy_number')
cn.columns = ncbi_gene_ids(list(cn.columns))

# cn.columns = ncbi_gene_ids(list(cn.columns))
# print(cn.shape)
# keep_genes = []
# for g in cn.columns:
#     if g in hotspot_genes:
#         keep_genes.append(g)
# cn = cn[keep_genes]
# print(cn.shape)
cn = cn.T
printmd('Sample copy number data:')
display(cn.head())
report('Copy number data descritive stats:')
display(cn.iloc[:,:10].describe())
In [15]:
report('''
## Search for high copy number genes in each of the lineages
* Seleting genes with copy number > 2 in <b><i>all</i></b> cell lines is a lineage is a bit too stringent
* Retain genes that have copy number >= 2 in 80% or more cell lines in a lineage
* Extract the data for any cell lines with high copy number genes to use as plotting baseline
''')
In [20]:
# for each cell line, get all of the genes with copy number > 2
keep_common_genes = []
keep_common_cells = []
keep_lineage = set()
keep_pairs = set()

report('<pre>')
for sublin in sublineage2cell:
    cells = sublineage2cell[sublin]
    #print(sublin,len(cells))

    best = {}
    for cell in cells:
        try:
            cdf = cn[cell]
            cdf = cdf[cdf >= 2]
            if len(cdf.index) > 0:
                best[cell] = set(cdf.index)
        except Exception as e:
            #print('Error',e)
            continue

    if len(best) == 0:
        continue

    best_genes = list(best.values())
    set1 = best_genes.pop()
    all_genes = set1.union(*best_genes)

    total = len(best_genes) + 1
    common_genes = []
    for g in all_genes:
        gcount = 0
        for gset in [set1,*best_genes]:
            if g in gset:
                gcount += 1
        if gcount / total >= 0.8:
            common_genes.append(g)


    keep_common_genes.extend(common_genes)
    common_symbols = [ncbi2symbol.get(g) for g in common_genes]
    if len(common_genes) > 0:
        keep_lineage.add(sublin)
        keep_common_cells.extend(cells)
        report(sublin+'; '+str(len(cells))+' cell lines; '+str(len(common_genes))+' high copy number genes')
        # Remember the gene:cell pairs to assemble the final table
        for cg in common_genes:
            for cell in cells:
                keep_pairs.add((cg,cell))
report('</pre>')

keep_common_genes = set(keep_common_genes)
keep_common_cells = set(keep_common_cells)
In [21]:
report('''
## DEMETER2 RNAi gene dependency data
Cancer cell line genetic dependencies estimated using the DEMETER2 model. DEMETER2 is applied to three large-scale RNAi screening datasets: the Broad Institute Project Achilles, Novartis Project DRIVE, and the Marcotte et al. breast cell line dataset. The model is also applied to generate a combined dataset of gene dependencies covering a total of 712 unique cancer cell lines.
<b>DepMap source file:</b> D2_combined_gene_dep_scores.csv
* Data source uses CCLE names rather than DepMap cell line IDS
* Translate the cell line names to IDS for consistency with other data sources
* Also deal with rows in the table with multiple gene names (eg 'GTF2IP4>F2IP1 (100093631&2970)')
''')
In [22]:
# Ingest data
d2 = get_data('d2_rnai')
print("Initial number of rows in dataframe:",d2.shape[0])
# split rows with multuple genes
cols = ['gene'] + list(d2.columns)
rows = []

print("Splitting multigene rows...")
for i, r in d2.iterrows():
    if '&' in i:
        symbols, ncbi = i.split(' ')
        symbols = symbols.split('&')
        ncbi = re.sub('\(|\)','',ncbi)
        ncbi = ncbi.split('&')
        assert len(symbols) == len(ncbi), "Length mismatch"
        for s, symbol in enumerate(symbols):
            gid = ncbi[s]
            row = [symbol+' ('+gid+')'] + list(r)
            rows.append(row)
    else:
        rows.append([i]+list(r))
d2 = pd.DataFrame(data=rows,columns=cols).set_index('gene')
print("Final number of rows in dataframe:",d2.shape[0])
In [23]:
# Map cell line names to IDs
sample_info = get_data('sample_info')
ccle_name2id = {}
for i, r in sample_info.iterrows():
    ccle_name2id[r['CCLE Name']] = i

cell_line_names = list(d2.columns)

# Rename columns to use CCLE IDs and rows to use NCBI gene IDs
if isinstance(list(d2.index)[0],str):
    d2.columns = [ccle_name2id.get(i) or i for i in cell_line_names]
    d2.index = ncbi_gene_ids(list(d2.index))
print(d2.shape[0],"genes")
print(d2.shape[1],"cell lines")
d2.head()
Out[23]:
In [24]:
report('''
## Achilles Crispr gene dependency data
CERES data with principle components strongly related to known batch effects removed, then shifted and scaled per cell line so the median nonessential KO effect is 0 and the median essential KO effect is -1.

<b>DepMap source file:</b> Achilles_gene_effect.csv

* Translate gene names (column labels) to NCBI IDS
* Transpose rows and columns so each cell line is a column label with vertivally stacked gene data
''')
In [25]:
achilles = get_data('achilles_crispr').T
genes = list(achilles.index)
achilles.index = ncbi_gene_ids(genes)
print(achilles.shape[0],"genes")
print(achilles.shape[1],"cell lines")
printmd('Sample Achilles data:')
achilles.head()
Out[25]:
In [26]:
report('''
### How many cell lines and genes are shared between D2 (RNAi) and Achilles (Crispr) gene dependency data sets?
''')
In [27]:
d2_cells = set(d2.columns)
d2_genes = set(d2.index)
ac_cells = set(achilles.columns)
ac_genes = set(achilles.index)
shared_cells = d2_cells.intersection(ac_cells)
shared_genes = d2_genes.intersection(ac_genes)
report('<pre>')
report(str(len(shared_cells))+" cell lines are shared")
report(str(len(shared_genes))+" genes are shared")
report('</pre>')
In [29]:
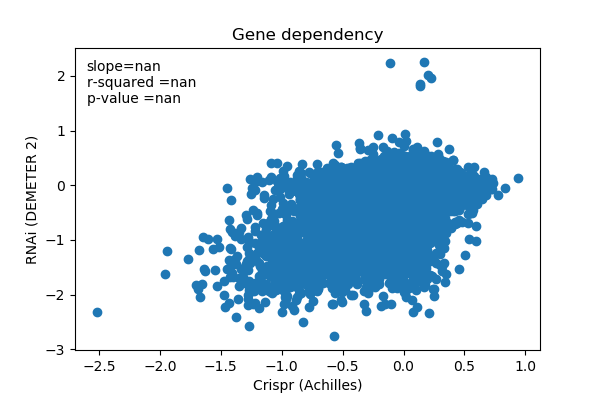
report('### How do RNAi and Crispr screen compare for gene dependency score?')
In [28]:
# filter shared genes to just include our high copy number genes
my_d2 = d2.copy()
keep_genes = set()
for g in shared_genes:
    if g in keep_common_genes:
        keep_genes.add(g)

keep_cells = set()
for c in shared_cells:
    if c in keep_common_cells:
        keep_cells.add(c)

d2_s = my_d2[keep_cells]
d2_s = d2_s.T[keep_genes].T
ac_s = achilles[keep_cells]
ac_s = ac_s.T[keep_genes].T


d2_data = d2_s.to_numpy().flatten()
ac_data = ac_s.to_numpy().flatten()

# remove NaN and Inf
keep_d2 = []
keep_ac = []
for i, num1 in enumerate(d2_data):
    num2 = ac_data[i]
    if not np.isfinite(num1) and np.isfinite(num2):
        continue
    keep_d2.append(num1)
    keep_ac.append(num2)
d2_data = keep_d2
ac_data = keep_ac
In [30]:
report('''
## Assemble the candidate gene table
1. Start with gene:cell pairs that were identified has having >= 80% high copy number for all cell lines in the sublineage
2. Get copynumber, Achilles (Crispr), D2 (RNAi), hotspot and expression data
3. Remove genes with copy number < 2 or Achilles (Crispr) dependency > 0
''')
In [34]:
# save the data
keep_saved_rows = []
for pair in keep_pairs:
    gene, cell = pair
    lineage = cell2sublineage[cell]
    symbol = ncbi2symbol[gene]

    # Get the copy number data for the gene:cell
    genes = set(cn.index)
    cells = set(cn.columns)
    if gene in genes and cell in cells:
        copynum = cn.loc[gene,cell]
        if copynum < 2:
            continue
    else:
        continue

    # get the Achilles gene dependency
    genes = set(achilles.index)
    cells = set(achilles.columns)
    if gene in genes and cell in cells:
        adata = achilles.loc[gene,cell]
        if adata > 0:
            continue
    else:
        continue

    # Get the RNAi gene dependency
    genes = set(d2.index)
    cells = set(d2.columns)
    if gene in genes and cell in cells:
        ddata = d2.loc[gene,cell]
    else:
        ddata = np.nan

    # Check if the gene is a mutation hotspot
    is_hotspot = gene in hotspot_genes

    # Check for expression
    genes = set(exp.index)
    cells = set(exp.columns)
    if gene in genes and cell in cells:
        edata = exp.loc[gene,cell]
    else:
        edata = np.nan
    is_expressed = edata > 0

    row = [cell,lineage,symbol,gene,copynum,adata,ddata,is_hotspot,is_expressed]
    keep_saved_rows.append(row)
In [35]:
cols = ['DepMap_ID','sublineage','HUGO_symbol','Entrez_ID','copy_number',
        'achilles_gene_dep','rnai_gene_dep','hotspot','rnaseq_expressed']
candidates = pd.DataFrame(data=keep_saved_rows,columns=cols)
set(candidates.sublineage)
Out[35]:
In [36]:
%matplotlib inline
plt.scatter(d2_data,ac_data)
slope, intercept, r_value, p_value, std_err = stats.linregress(d2_data,ac_data)
plt.xlabel('Crispr (Achilles)')
plt.ylabel('RNAi (DEMETER 2)')
plt.title('Gene dependency')
plt.text(-2.6,2.1,'slope='+'%.3f'%slope)
plt.text(-2.6,1.8,'r-squared ='+'%.3f' %r_value)
plt.text(-2.6,1.5,'p-value ='+'%.3f'%p_value)
plt.savefig('plots/gene_dependency.png',dpi=100)
plt.close()

report('<img src="plots/gene_dependency.png">')
report('* significant p-value means reject H0 that slope == 0')
report('* We will use the Achilles (Crispr) gene dependency score and check for positive agreement with RNAi later')
In [39]:
keep_genes = set()
for g in ac_genes:
    if g in keep_common_genes:
        keep_genes.add(g)

keep_cells = set()
for c in ac_cells:
    if c in keep_common_cells:
        keep_cells.add(c)
keep_cells = list(keep_cells)

ac_s = achilles[keep_cells]
ac_s = ac_s.T[keep_genes].T
cn_s = cn[keep_cells]
cn_s = cn_s.T[keep_genes].T

ac_data = ac_s.to_numpy().flatten()
cn_data = cn_s.to_numpy().flatten()

# remove NaN and Inf
keep_ac = []
keep_cn = []
for i, num1 in enumerate(ac_data):
    num2 = cn_data[i]
    if not np.isfinite(num1) and np.isfinite(num2):
        continue
    keep_ac.append(num1)
    keep_cn.append(num2)

ac_data = keep_ac
cn_data = keep_cn
cn_orig = cn_data
ac_orig = ac_data
In [40]:
report('''
### Sanity checking with ERBB2 (2064)
Evaluating breast cancer lineages where at least one cell line had copy number > 2:
* Is ERB2B in the hotspot gene set?
* We expect ERBB2 to have high copy number in breast cancer lineages
  ** What is the mean ERB2B copy number in breast cancers?
* The gene dependency score should be < 0
  ** What is the mean gene dependency score in breast cancers?
''')
In [41]:
report("ERBB2 is in hotspot gene set? <b>"+str(2064 in hotspot_genes).upper()+"</b>")
report('<pre>')

erb = cn.loc[2064]
nums = {}
is_high = set()
for c in cell2sublineage:
    lin = cell2sublineage.get(c)
    if lin is None or erb.get(c) is None:
        continue

    if 'breast' in lin:
        if nums.get(lin) is None:
            nums[lin] = []
        nums[lin].append(erb[c])
        if erb[c] >= 2:
            is_high.add(lin)
            #report(','.join([c,lin,str('%.2f'%erb[c])]))
for lin in nums:
    if lin in is_high:
        report("ERBB2 mean copy number for "+lin+" ("+str(len(nums[lin]))+" cell lines): "+str('%.2f'%np.mean(nums[lin])))

erb_gd = achilles.loc[2064]
nums = {}
for c in erb_gd.keys():
    lin = cell2sublineage.get(c)
    if lin is None or not 'breast' in lin:
        continue

    if nums.get(lin) is None:
        nums[lin] = []
    nums[lin].append(erb_gd[c])

for lin in nums:
    #if lin in is_high:
    report("ERBB2 mean gene dependency for "+lin+" ("+str(len(nums[lin]))+" cell lines): "+str('%.2f'%np.mean(nums[lin])))

report('</pre>')
In [42]:
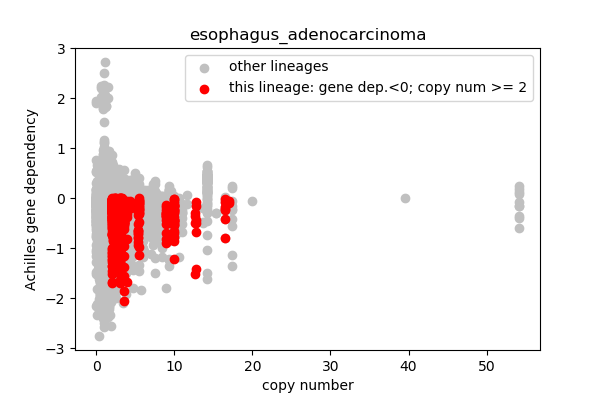
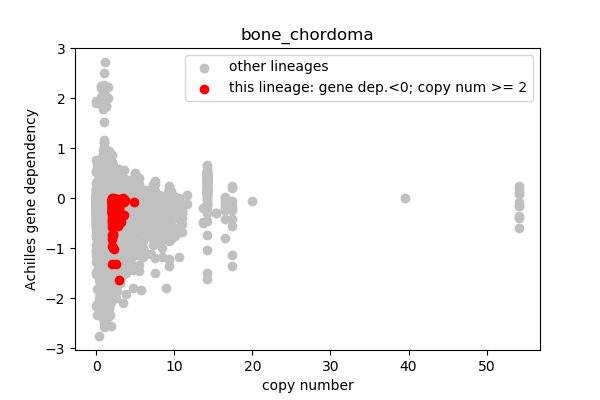
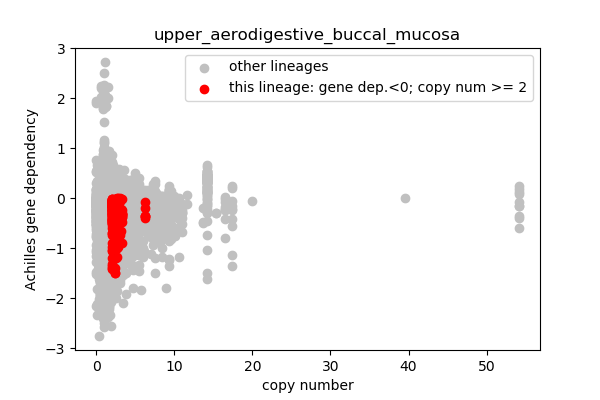
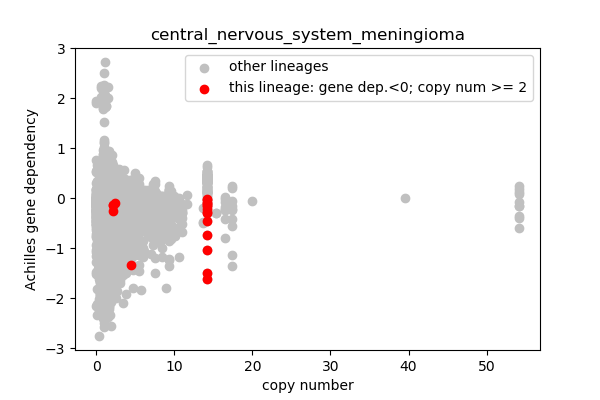
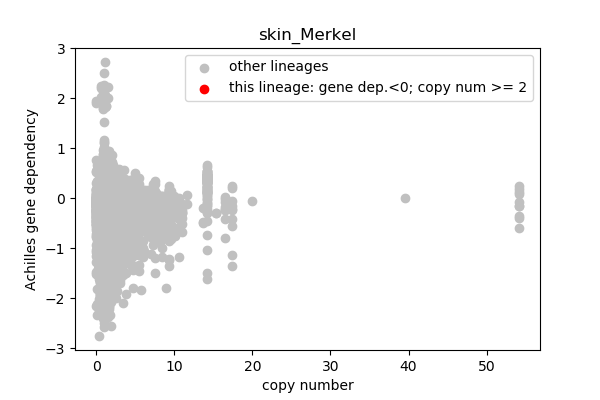
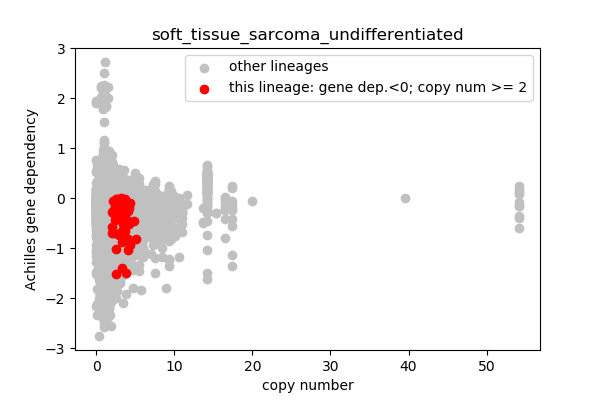
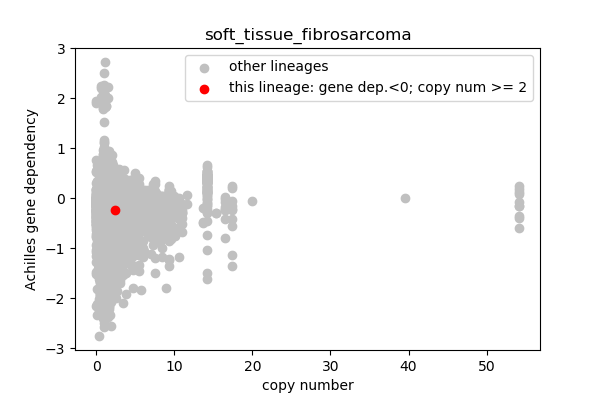
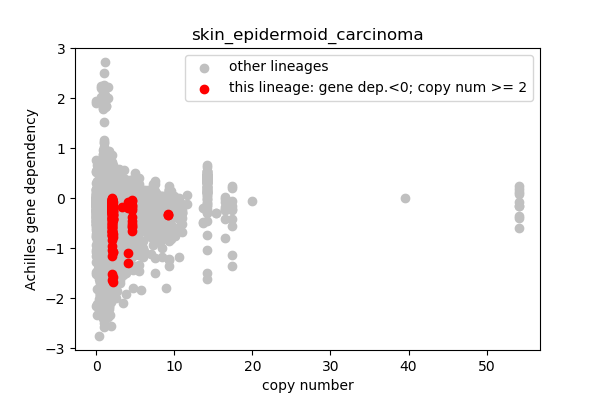
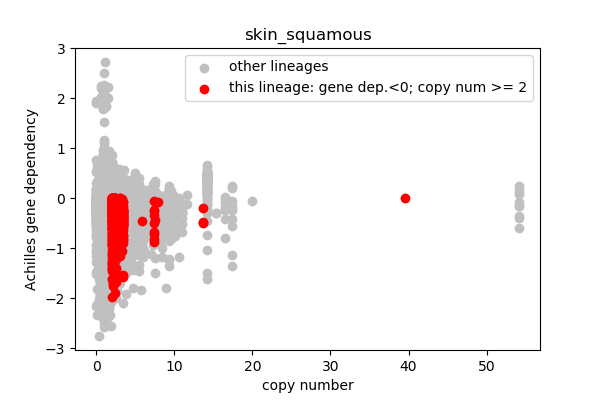
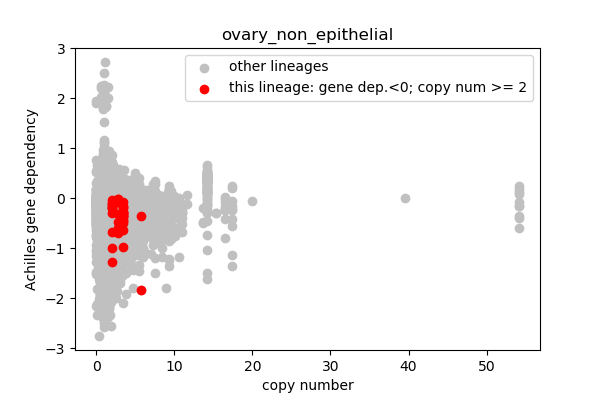
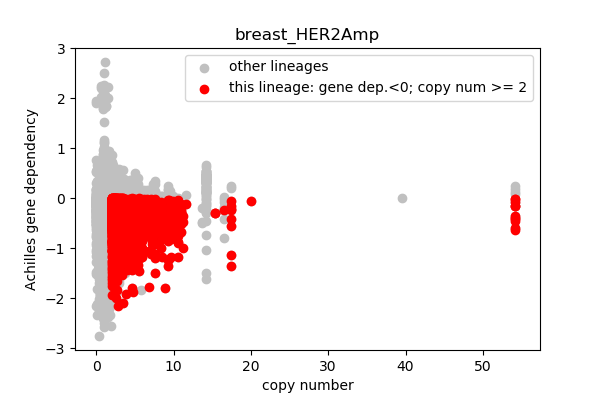
report('''
## Lineages with observed high copy number genes

* Go through the list of lineages with high copy number genes
* Plot gene dependency vs. copy number
* Highlight genes/cell-lines with copy number > 2 and gene dependency < 0 for specific lineages

### Copy number vs gene dependency
''')
In [43]:
for sublin in keep_lineage:
    cells = sublineage2cell[sublin]

    best = {}
    genes = set()
    for c in cells:
        try:
            cdf = cn[c]
            cdf = cdf[cdf >= 2]
            best[c] = set(cdf.index)
            for g in best[c]:
                genes.add(g)

        except Exception as e:
            #print('Error',e)
            continue

    if len(best) == 0:
        continue

    keep_cells = set()
    for c in ac_cells:
        if c in cells:
            keep_cells.add(c)
    if len(keep_cells) == 0:
        #print("no shared cells")
        continue

    keep_genes = set()
    for g in ac_genes:
        if g in genes:
            keep_genes.add(g)
    if len(keep_genes) == 0:
        print("no shared genes")
        continue

    try:
        ac_s = achilles[keep_cells]
        ac_s = ac_s.T[keep_genes].T
        cn_s = cn[keep_cells]
        cn_s = cn_s.T[keep_genes].T
    except:
        continue

    ac_data = ac_s.to_numpy().flatten()
    cn_data = cn_s.to_numpy().flatten()

    # remove NaN and Inf
    keep_ac = []
    keep_cn = []
    for i, d1 in enumerate(ac_data):
        d2 = cn_data[i]
        # Skip gene dependency > 0
        if d1 >= 0:
            continue
        # Skip copy number < 2
        if d2 < 2:
            continue

        if not np.isfinite(d1) and np.isfinite(d2):
            continue
        keep_ac.append(d1)
        keep_cn.append(d2)

    ac_data = keep_ac
    cn_data = keep_cn

    plt.scatter(cn_orig,ac_orig,c='silver',label='other lineages')
    plt.scatter(cn_data,ac_data,c='r',label='this lineage: gene dep.<0; copy num >= 2')
    plt.legend()
    outfile = 'plots/'+sublin+'.png'
    plt.xlabel('copy number')
    plt.ylabel('Achilles gene dependency')
    plt.title(sublin)
    plt.savefig(outfile,dpi=100)
    plt.close()
    report('<img src="'+outfile+'">')
In [49]:
# Save the table of candidates to an HTML file
# Make gene symbol a link
rows = []
cols = candidates.columns
for i, r in candidates.iterrows():
sym = r.HUGO_symbol
sym = '<a href="reports/'+sym+'.html" target="gene_info">'+sym+'</a>'
r.HUGO_symbol = sym
rows.append(r)
report = pd.DataFrame(data=rows,columns=cols)
table = report.to_html(index=False)
table = table.replace('<table','<table id="candidates"')
table = table.replace('>','>')
table = table.replace('<','<')
with open('../_includes/template.html','r') as html_in:
html = html_in.read()
html = html.replace('TABLE',table)
with open('../_includes/candidates.html','w') as html_out:
html_out.write(html)
In [44]:
report('## Candidate target genes')
report('''
* All genes in this table have copy number > 2 and Achilles gene dependency < 0 for at least 80% of the cell lines in 1 cell lineage'
* Other data for cross-validation:
  * RNAi gene dependency score
  * Whether the gene is a TCGA or COSMIC mutation hotspot
  * Whether the gene has > 0 TPM RNASeq expression

{% include candidates.html %}
''')
In [45]:
genes = candidates[['HUGO_symbol','Entrez_ID']].drop_duplicates()
pathway_info = get_pathway_info()
for symbol, gene in genes.values:
    gene = str(gene)
    with open('../reports/template.html','r') as html_in:
        html = html_in.read()
    html = html.replace('SYMBOL',symbol)

    pathway = pathway_info.get(gene)
    if pathway is not None:
        pid, url, name = pathway
        html = html.replace('PNAME','<a href="'+url+'" target="_BLANK">'+name+'</a>')
        html = html.replace('START_HIDE','')
        html = html.replace('END_HIDE','')
    else:
        html = html.replace('START_HIDE','<!--')
        html = html.replace('END_HIDE','-->')

    symbol = symbol.replace(' ','_')
    try:
        with open('../reports/'+symbol+'.md','w') as html_out:
            html_out.write(html)
    except:
        pass
In [46]:
report('\n\n<h2>Links to gene information</h2>')
report('DepMap summary, expression, Reactome pathways<br>')
for g in set(candidates.HUGO_symbol):
    report('<a href="reports/'+g+'.html">'+g+'</a><br>')
